Satellites Charts
Cinzia Bongino#ArtificialSatellites #SpaceInfrastructure #RemoteSensing
“Satellites Charts” plots past and current artificial satellites orbiting around Earth, pointing out how our terrestrial life became so dependent on what we sent out in space.

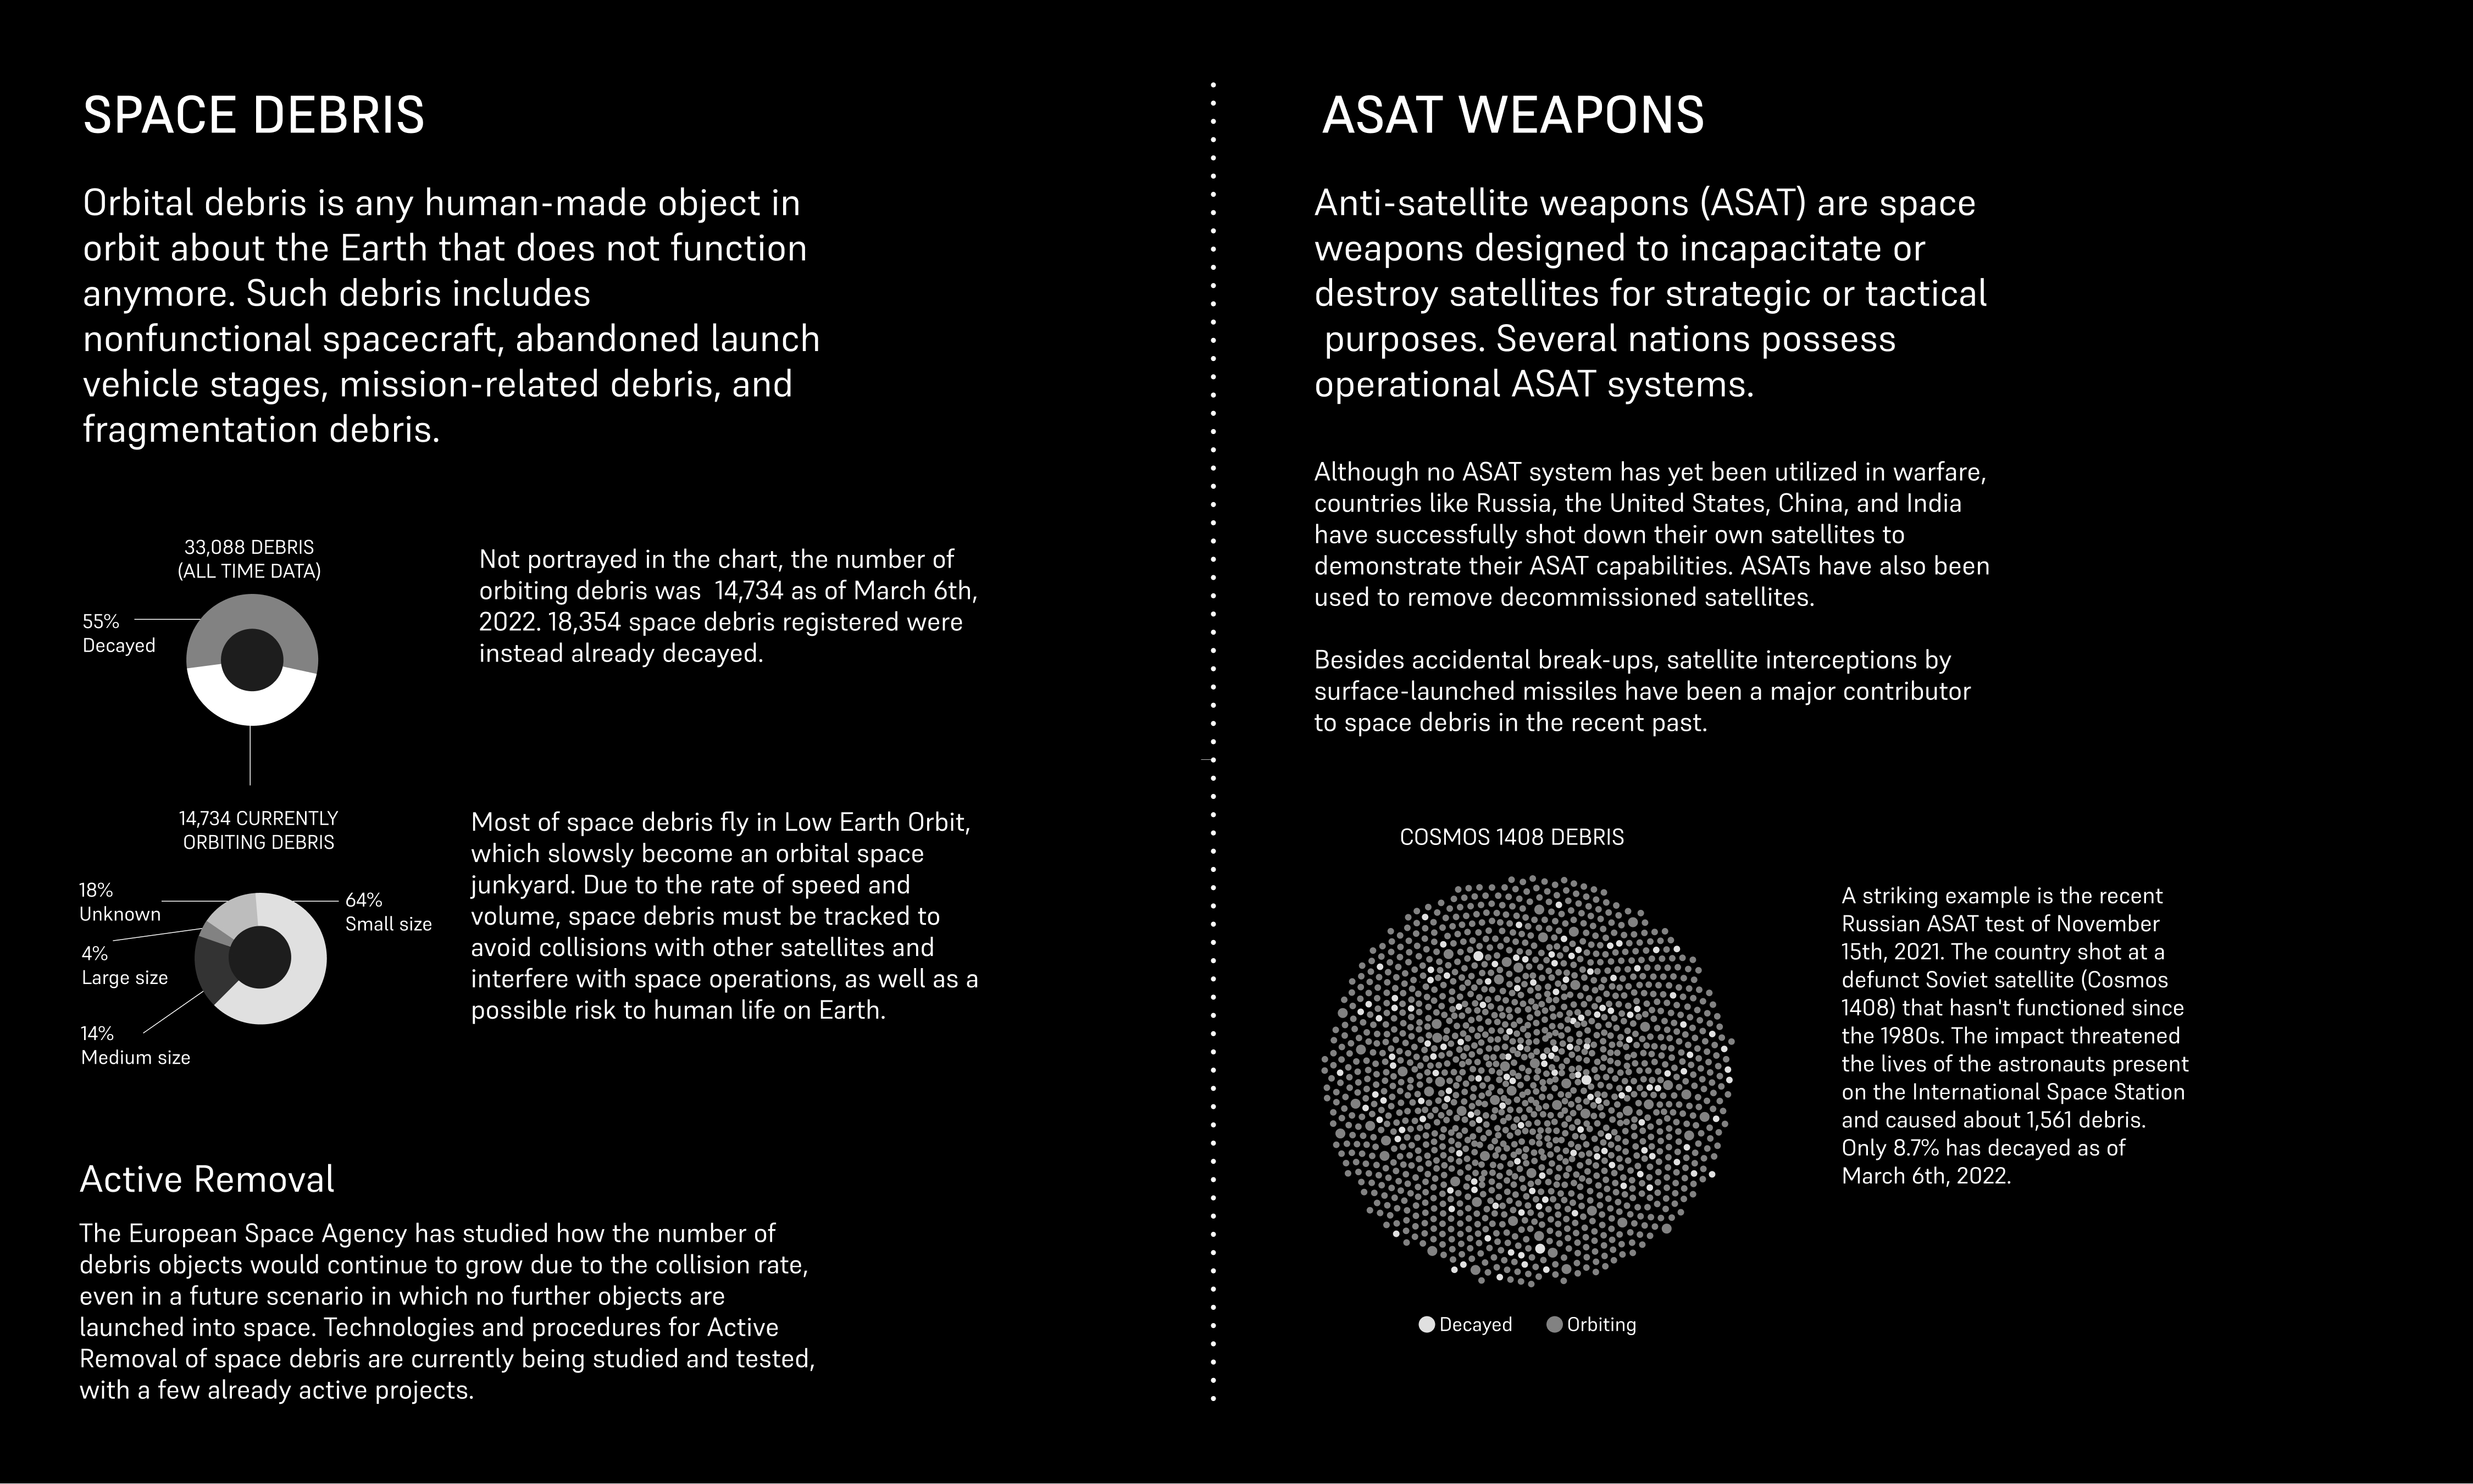
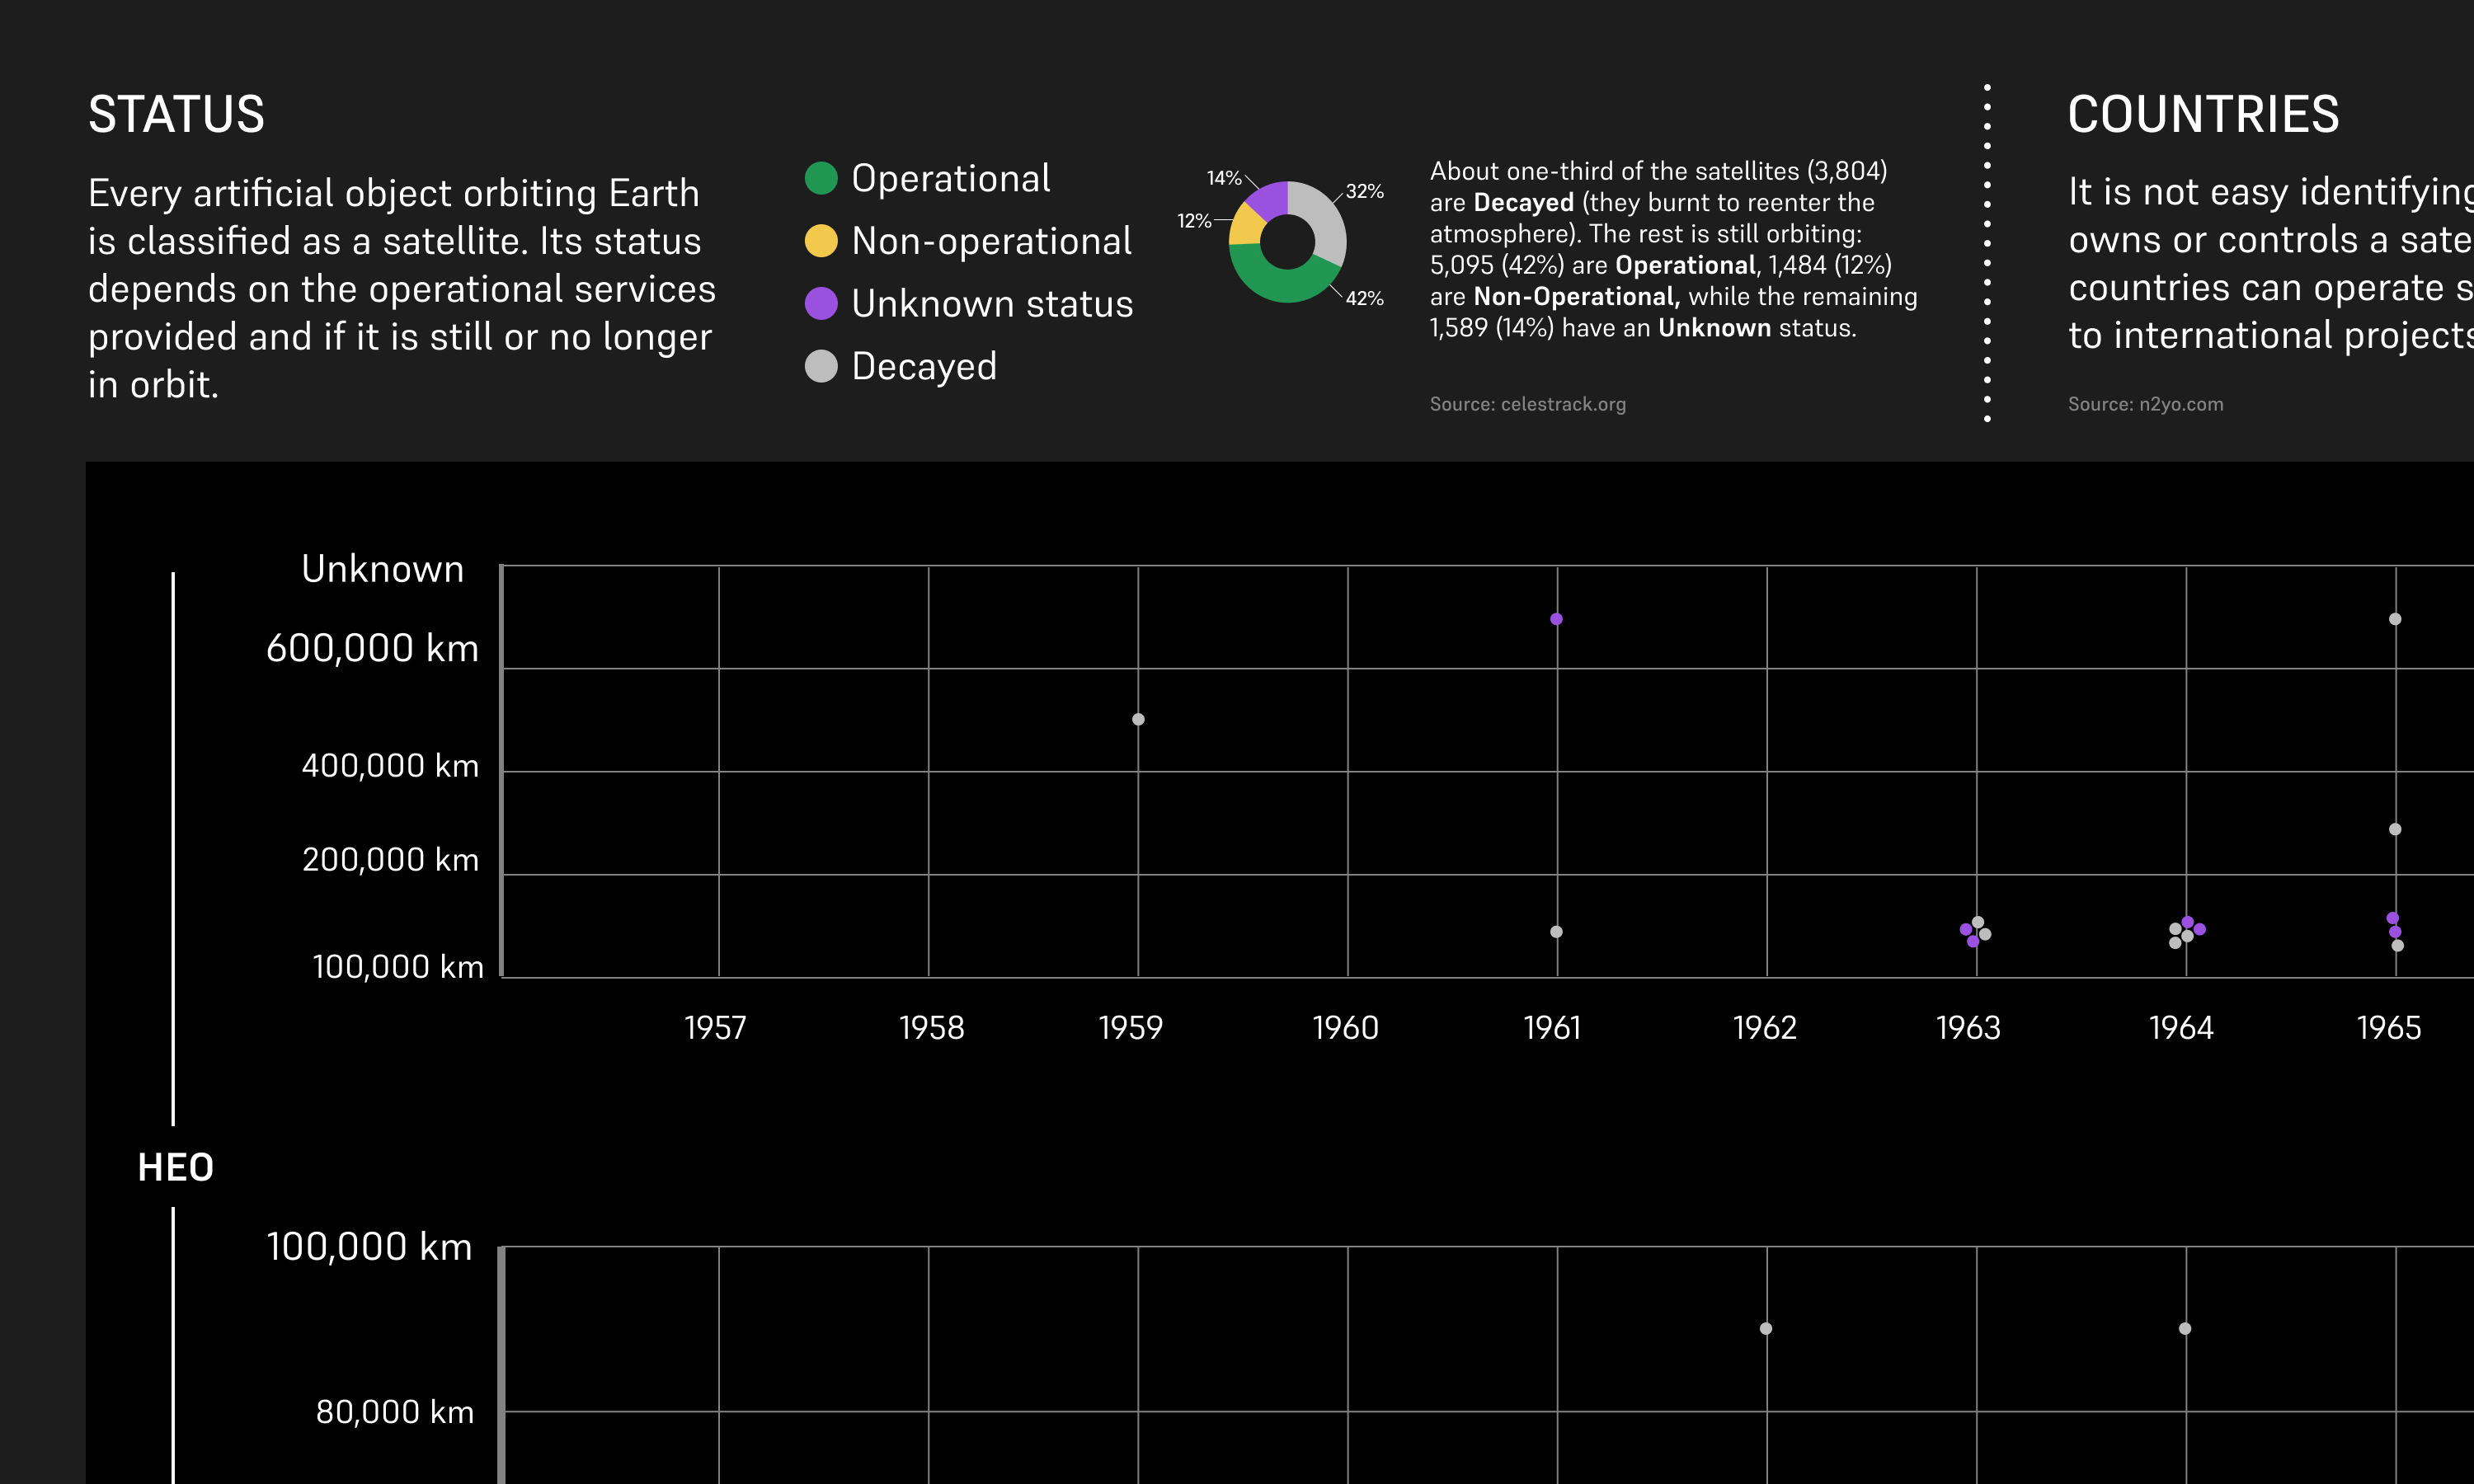
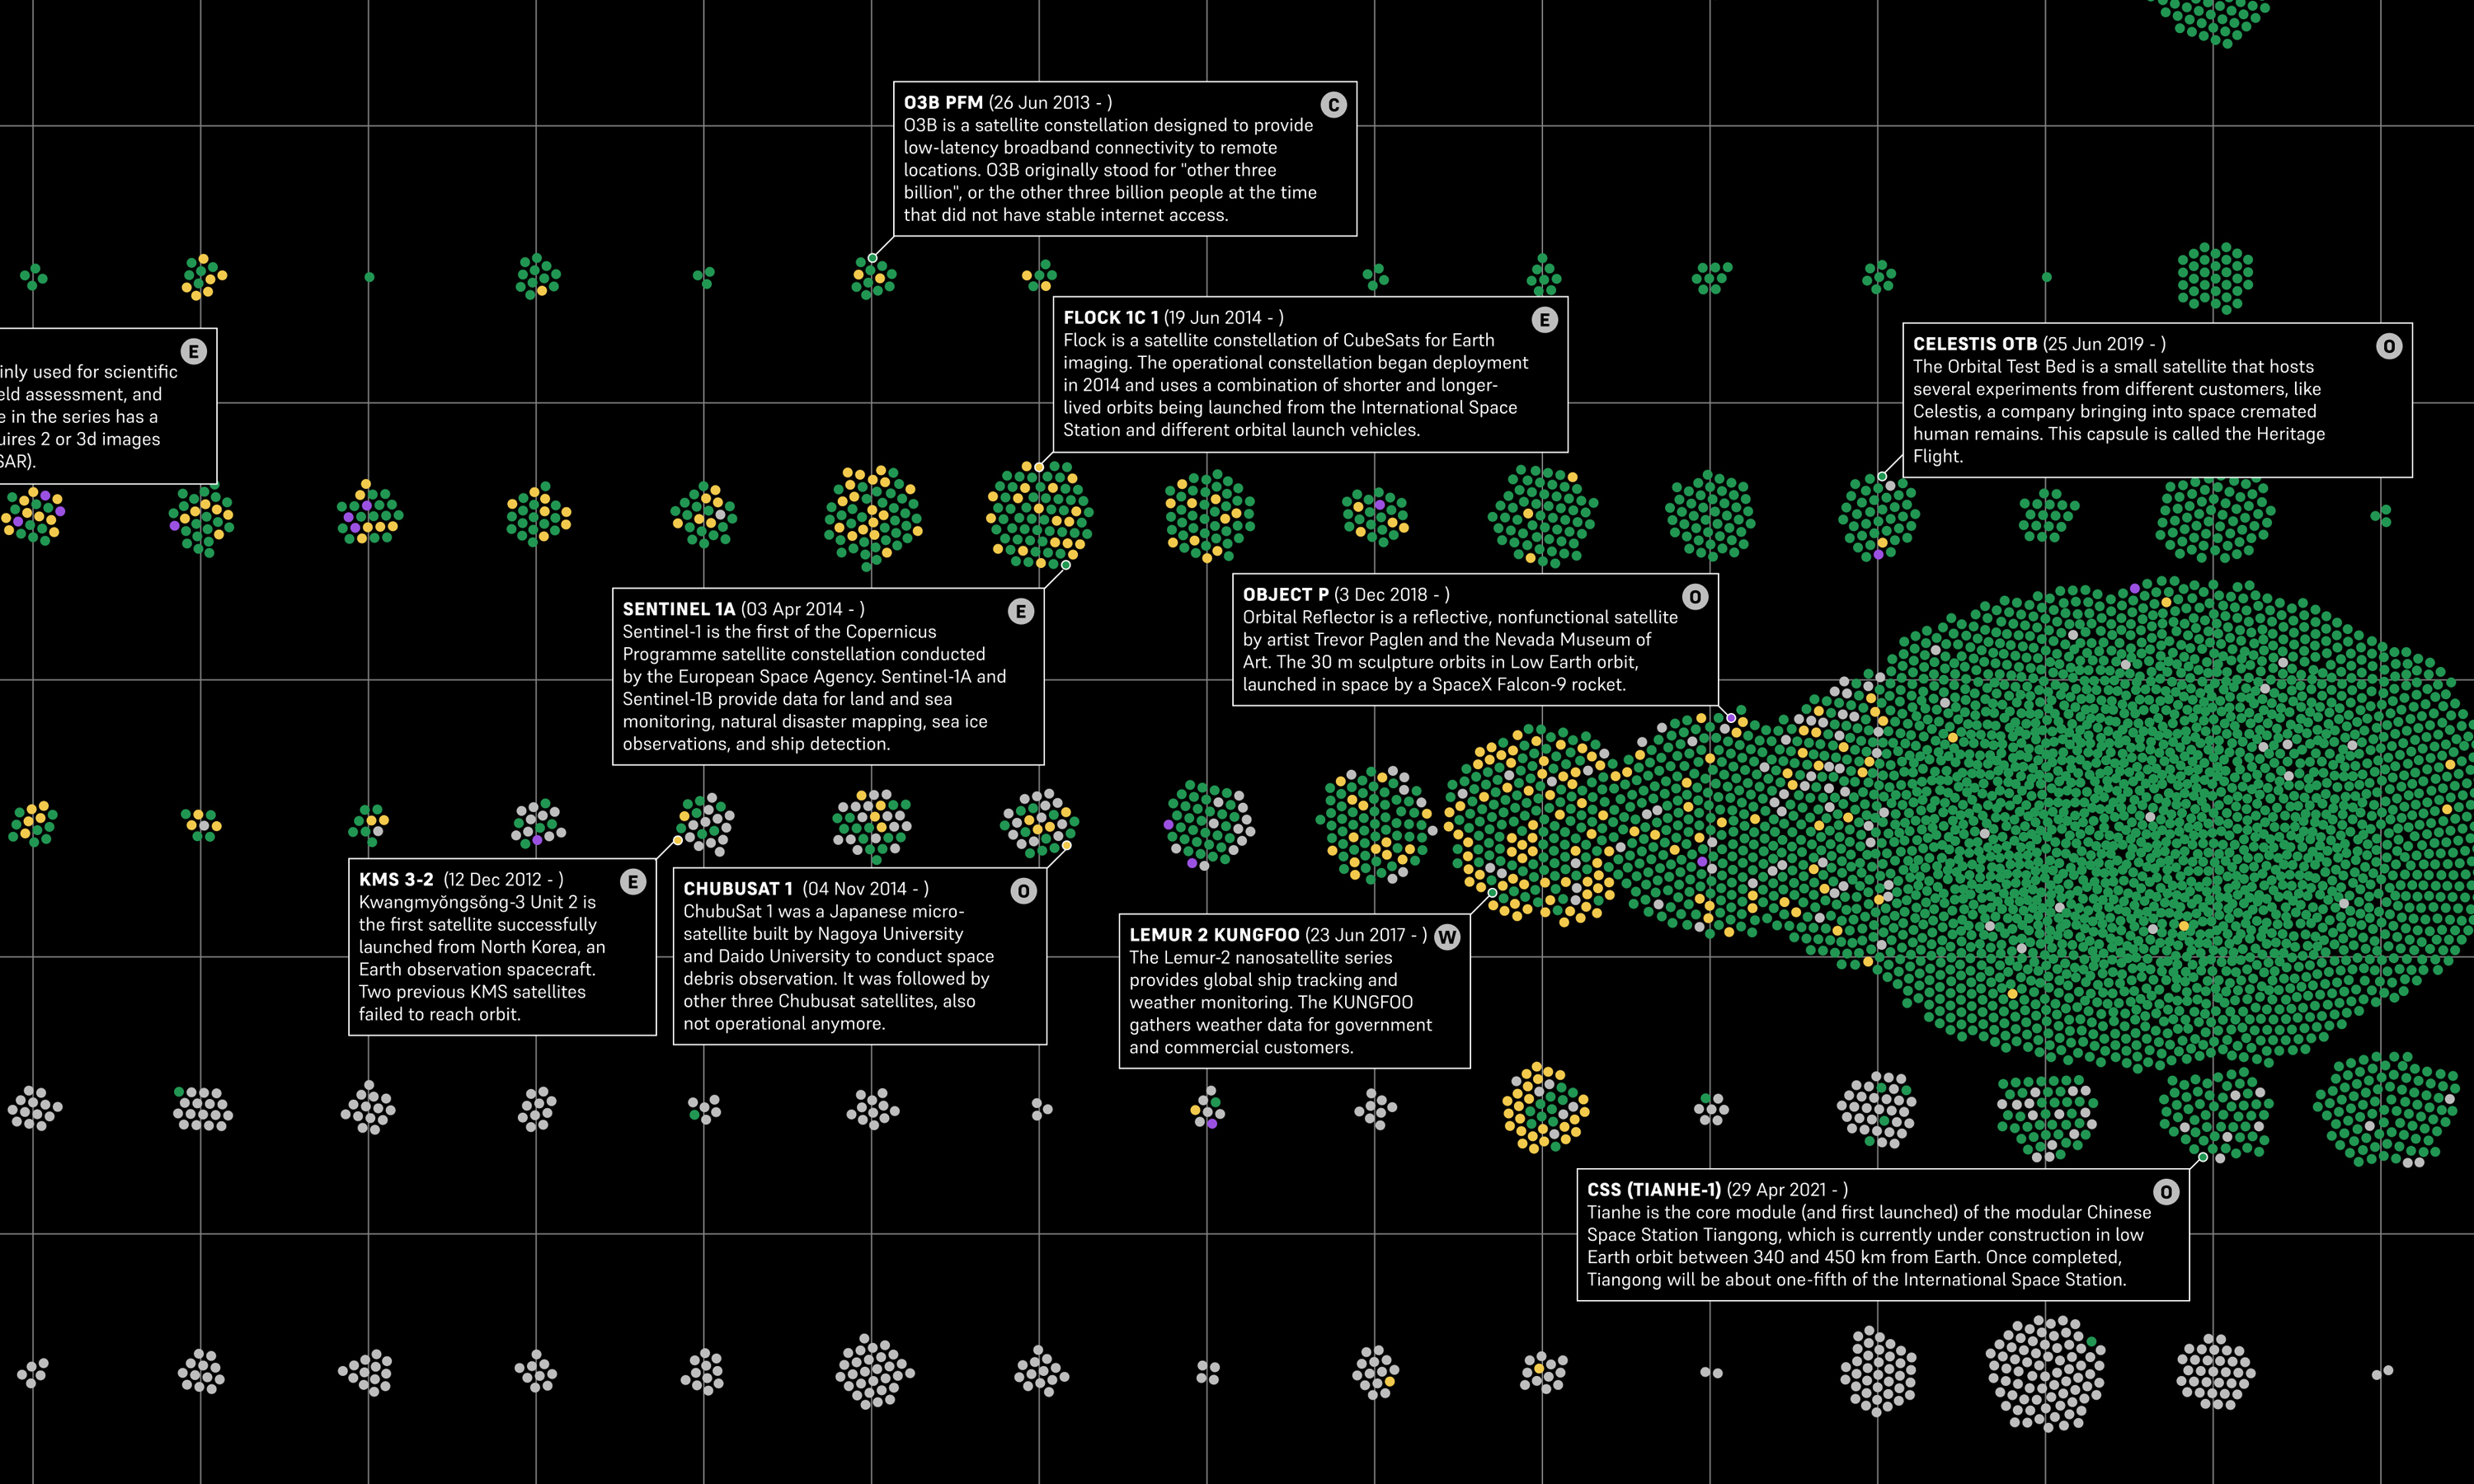
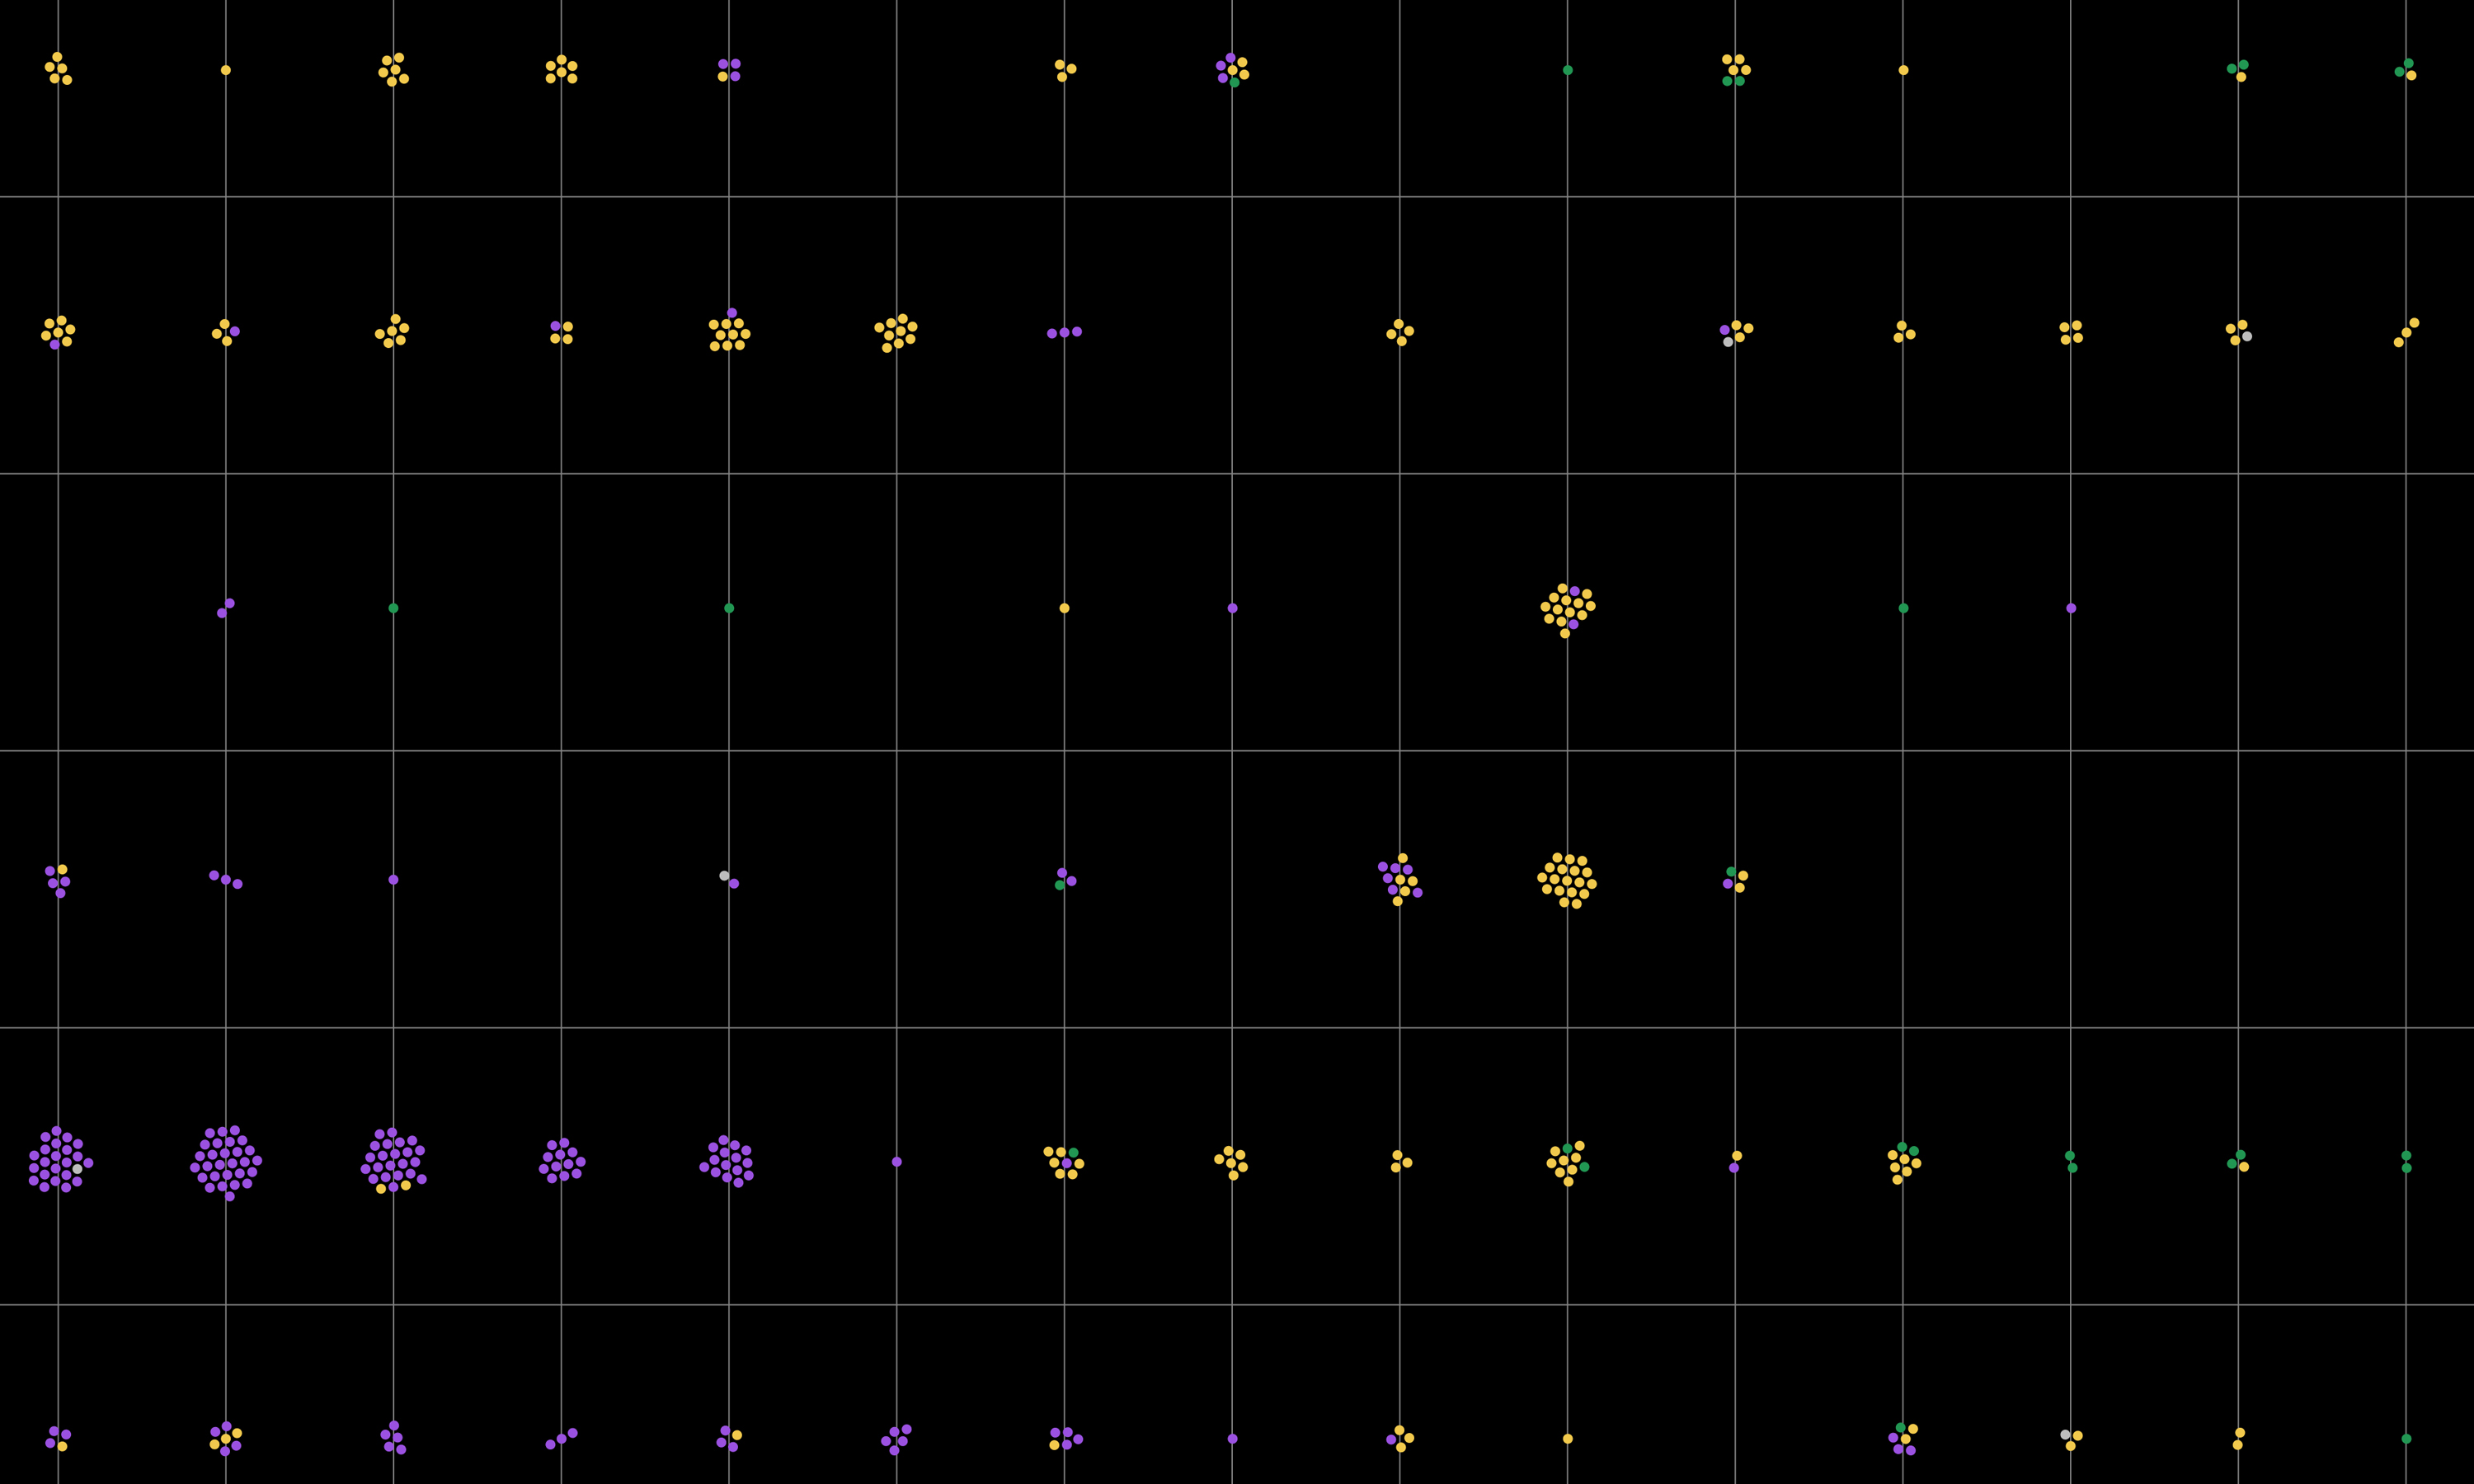
“Satellites Charts” examines current and past artificial satellites orbiting around Earth, pointing out how our terrestrial life became so dependent on what we sent out in space. With topics ranging from space exploration to space pollution, communication, and warfare, the data visualization functions as an index to unlock related stories. More than eight thousand satellites are plotted on the chart: the data show how many satellites are still operational or decayed, who launched them, and in which years.
Displaying such information on a flat design allows the viewer to zoom in and out in time. In about 70 years of space history, we slowly built an extension of Earth's infrastructure above our head, an extra level of data collection and exchange. Satellites are essential technologies that must be constantly safeguarded, especially from human threats: jobs, services, social gatherings, transport, and communications are strictly dependent on the network of artificial bodies monitoring the planet. It is impossible to imagine our current living standards and global connections without the data transmission between satellites and Earth stations. This is what keeps the world spinning.
Explore more on www.satellitecharts.xyz